 Drawing
expected velocities curves.
Drawing
expected velocities curves.
There are two variantsof expected velocities presentation.
1. The program calculates and
drawsvelocity curves for selected station and all events from the
catalog. To invoke this variantclick selected station in the right
lower !! list, and push

button. A
window with a series of velocitygraphs will appear. Each expected
velocities graph forstation-earthquake pair looks as following:
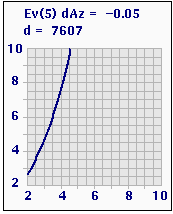
where Ev(5)- graph for 5-th (in catalog) event;
dAz - difference of azimuthsfrom the station to 5-thevent
and to main event;
d - distancefrom the station to the 5-th event;
horizontal coordinate axis - velocities of signals coming from the main
event (km/sec);
vertical coordinate axis - expectedvelocities of signals coming from
the 5-th event (km/sec).
If the number of pages is more then 1, click

or

to display next or previous page.
To exit the graphs window push

button.
2. The program calculates and
draws velocity curves for selected event and all stations from the right
lower list. To invoke thisvariant click selected event in the upper
list, and push 'OK' button (or double-click the event).A windowwith a
series of velocity graphs will appear.
Each expected velocities graph forstation-earthquake pair looks as
following:
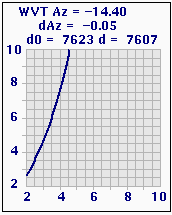
where
WVT - the station name.
Az - azimuth from Mainevent epicenter to the station;
dAz - difference of azimuthsfrom the station WVT toselected event
and to main event;
d0 - distanceto the main event;
d - distanceto selected event;
horizontal coordinate axis - velocities of signals coming from the main
event (km/sec);
vertical coordinate axis - expectedvelocities of signals coming from
the selected event (km/sec).
If the number of pages is more then 1, click
or
to display next or previous page.
To exit the graphs window push
button.
