 Main window .
Make New or Open saved earlier Project. The
following window will appear.
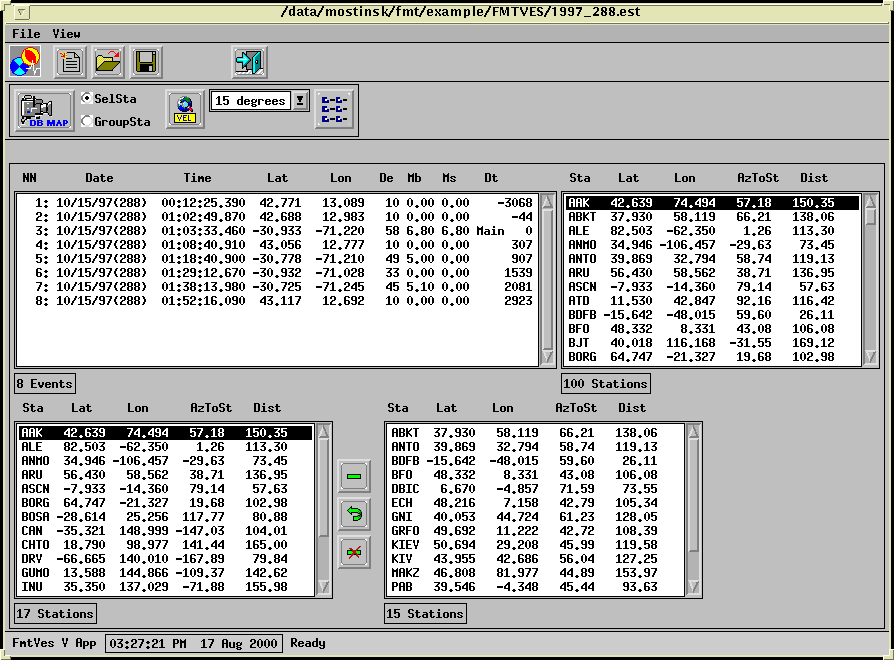
The leftupper list is the events list. "Dt" column indicates
time delay of everyevent with respect to the Main earthquake.
The right upper list contains names and coordinates of
all stations that recordedthe main earthquake.
The left lower list contains names and coordinates
of stations selected for analysis. Every station of this list is the
representative station of one clustershown in the right lower list. The cluster
contains stations which havethe azimuth from epicenter to station
not greater then thedAz shown in the combo box ( second tool bars line).
By default dAzis equal to 10 degrees. You can change
the dAz value fromcombo box and then it is necessary to
Push

to recalculate station clusters.
Use the following buttons to modify the low
lists.

- to mark a station that will be excluded
from the analysis.

- to change the representative station of
the cluster by highlighting the representative (left lowe list) and the newly
choosen stationfrom the cluster (right lower list), a
Toselect representative station - click by left mouse buttonon
correspondent row of the left low list. All of station of the group
correspondingthis selected station appears in the right low list. Then select
one of station in right low list and push
button. Selected station from right list will be the base station
in thegroup. The station from left list appears in the right list.

- for unmark marked station. This station will be
include for viewing map and expected velocities curves.
Push button

to draw the map of events and stations from the selected stations
list.
To get help for working with map push the "?" key
when the cursor is in the map window. Following list of commandswill
appear on console:
? help
q quit and keepwindow
Q quit and destroywindow
i small zoom in
I big zoom in
o small zoom out
O big zoom out
p pan
E great circleto closest event
e identify closestevent
s identify closeststation
t enter time range
1 orid labelson/off
2 depth coloringon/off
3 shallow depthcoloring on/off
4 shallow depthdiff coloring on/off
5 sta symbolson/off
6 mark pdevs on/off
7 mag size on/off
8 distance circleson/off
9 sta names on/off
Use these commands to modify the map if needed.
To exit main window push

button.