
| Home| Content |
|
5. Processing performance
Until you didn’t select a station and channel to be
processed the light of semaphore button is red  . Click on ‘+’ near selected station, available
channels will appear. Click on one of them. The semaphore light will change
to yellow
. Click on ‘+’ near selected station, available
channels will appear. Click on one of them. The semaphore light will change
to yellow  . The program is ready for processing of selected seismograms. Click on semaphore
button. The semaphore light will change to green
. The program is ready for processing of selected seismograms. Click on semaphore
button. The semaphore light will change to green  , and selected waveforms will be plotted
Note, that the raw waveforms can be plotted at any moment by clicking
on the button  .
.
To apply bandpass filtering click the button  .
.
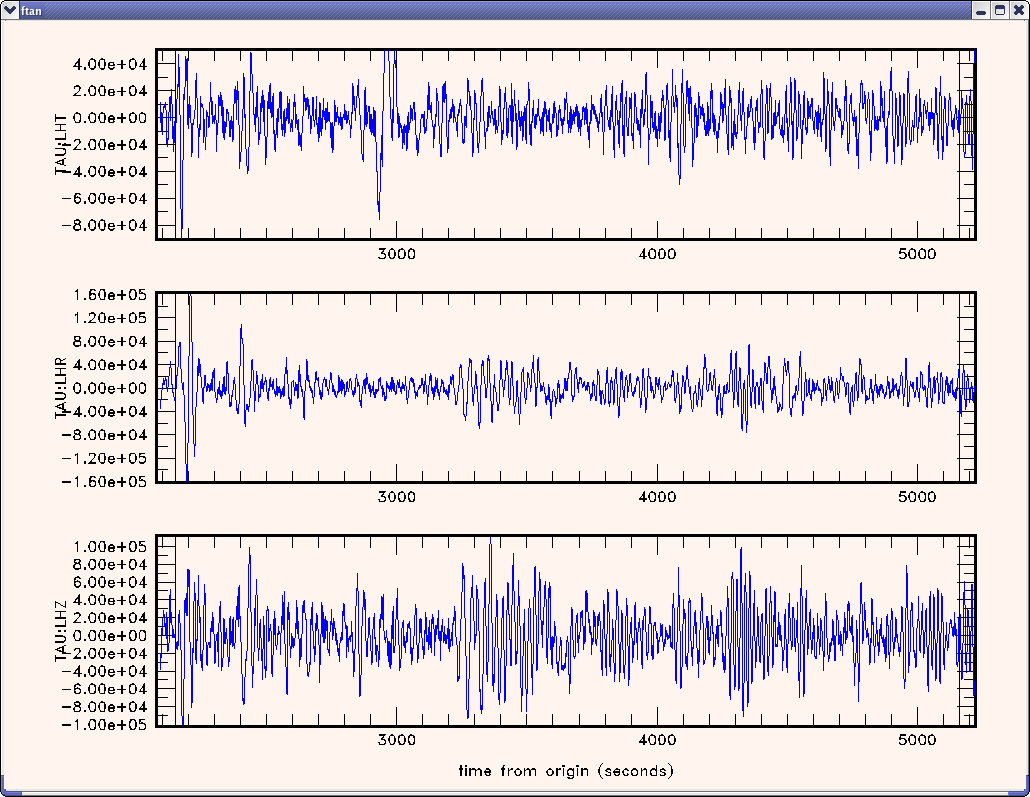
Filtered records will be plotted
To view FTAN maps for selected
components and to make floating filtering push the button  .
.
Here is an example of FTAN map:
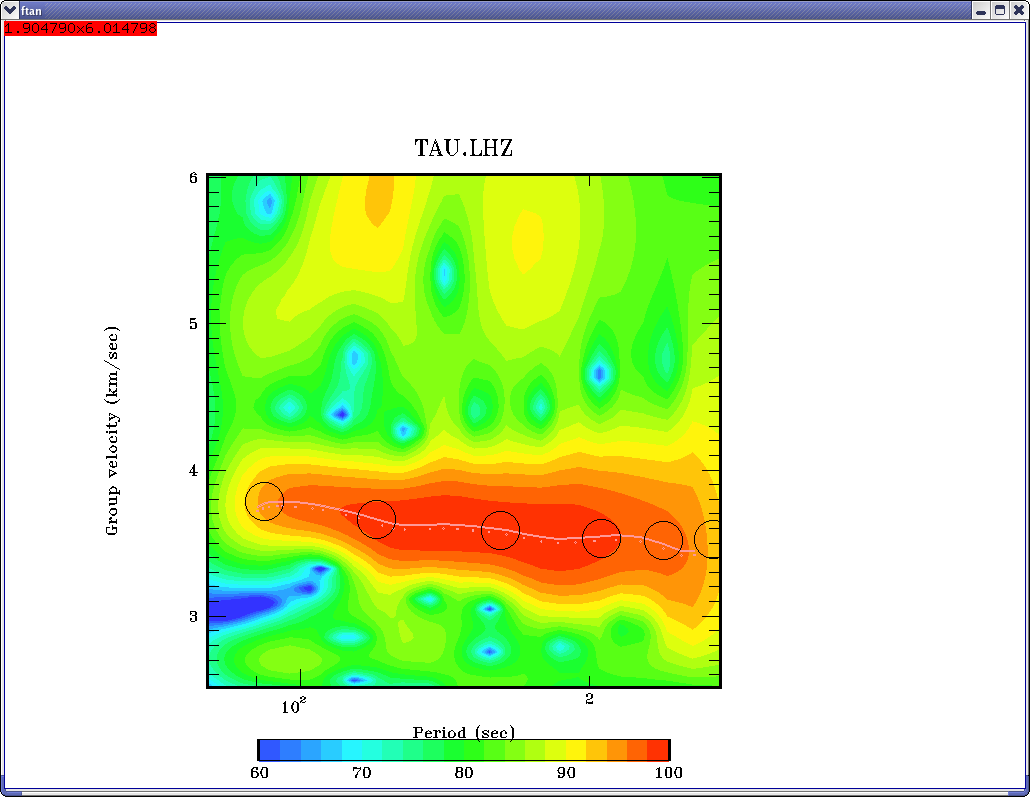
To make a floating filtering it is necessary to plot dispersion curve to make phase equalization (black circles). Use mouse to do this. Click left mouse button to put a point and right one to delete point nearest to cursor location. To finish type "e".
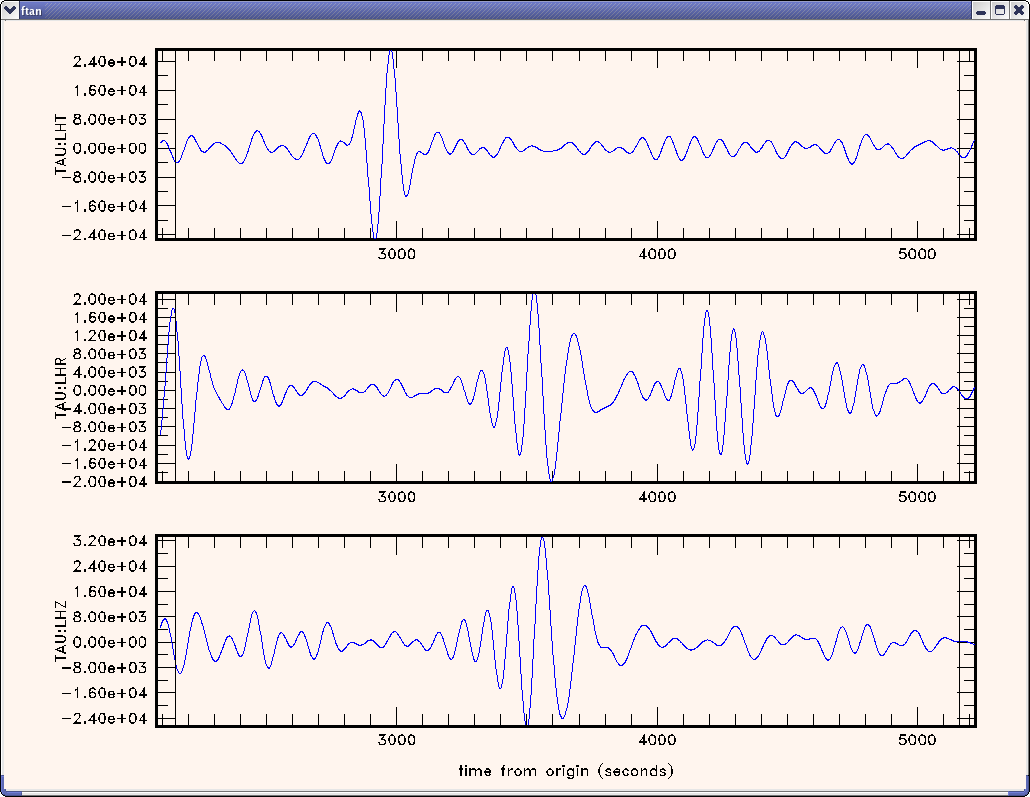
The picture of envelope of signal will appear:
It is necessary to cut a signal which you've selected. This signal is concentrated near the center of picture (red vertical line). To do this you must set four points to define the filtering window with cosine edges. Use the same commands as above.
The picture of
FTAN map for a cleaned signal will appear:
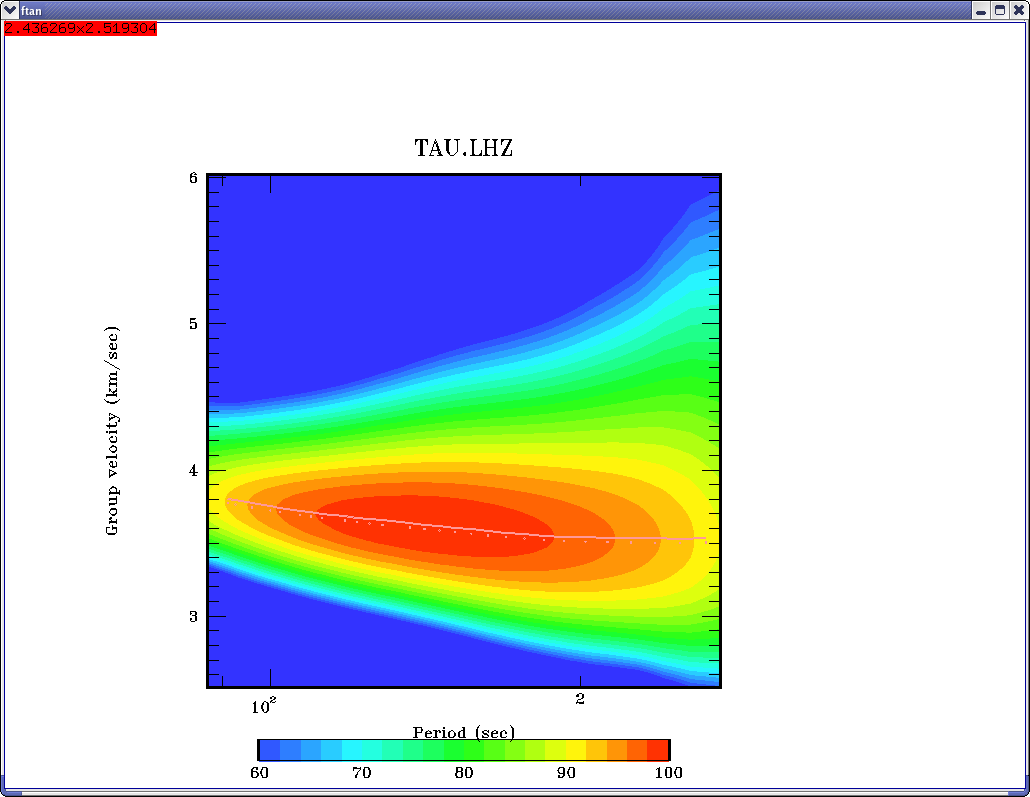

The thin lines are theoretical curves for PREM model.
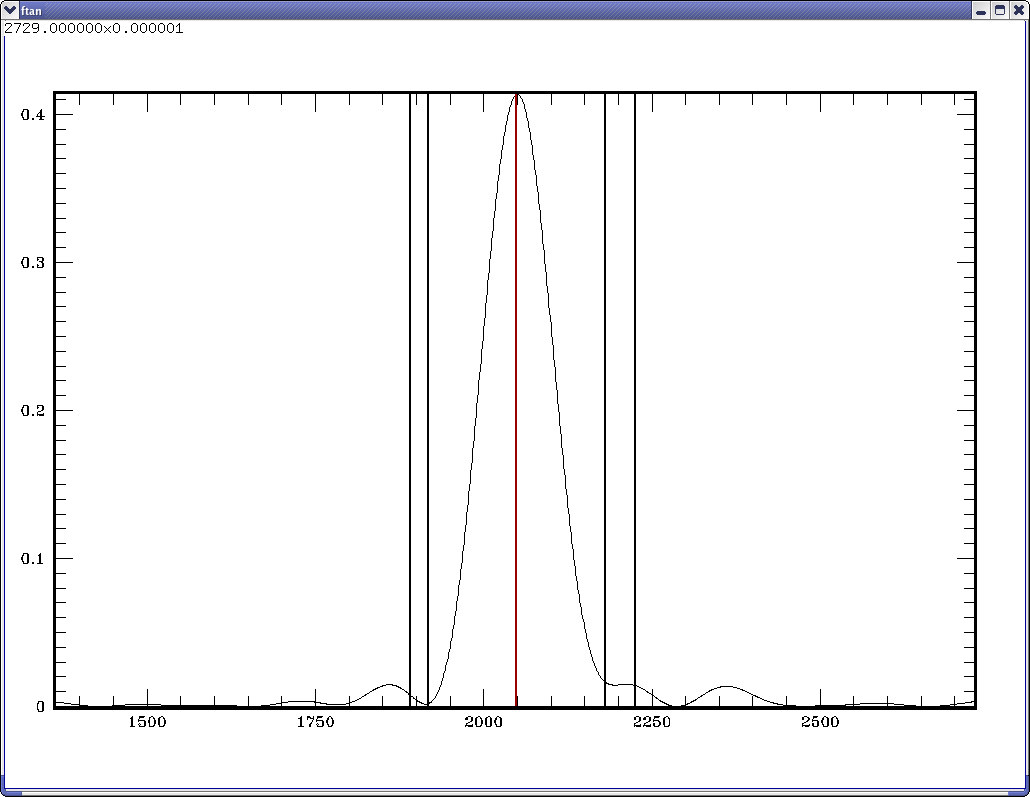
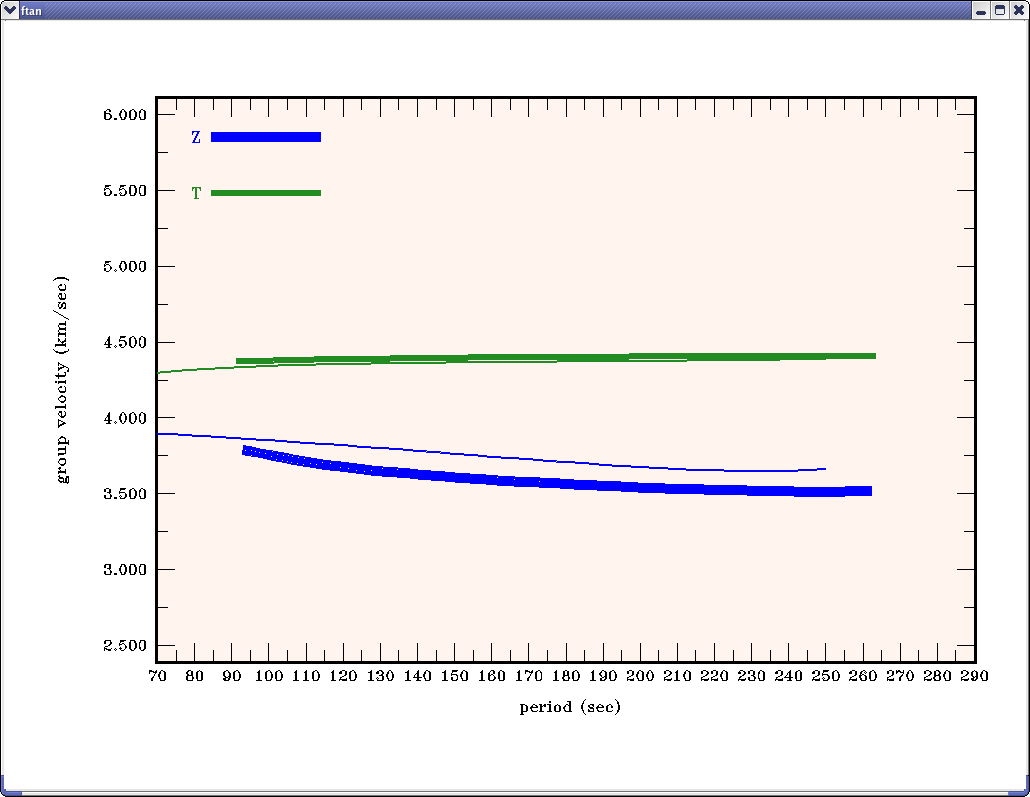
To view amplitude spectra push the button 
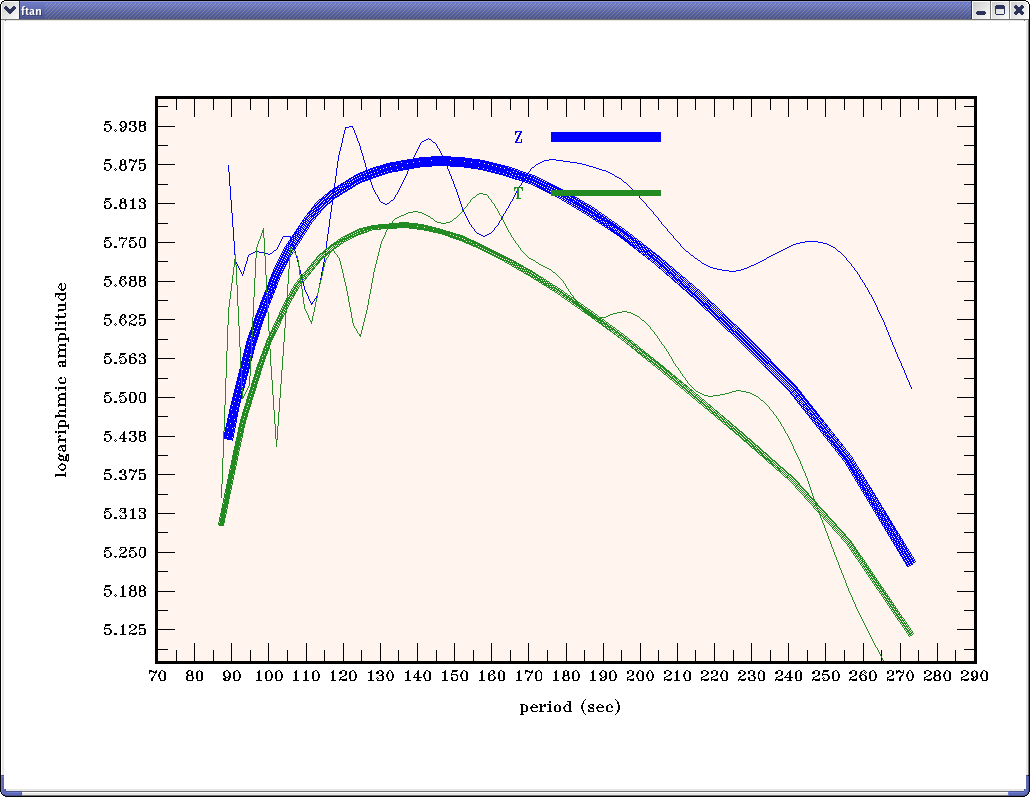
Thin lines present the amplitude spectra of raw signals; thick lines present the amplitude spectra of cleaned signals.
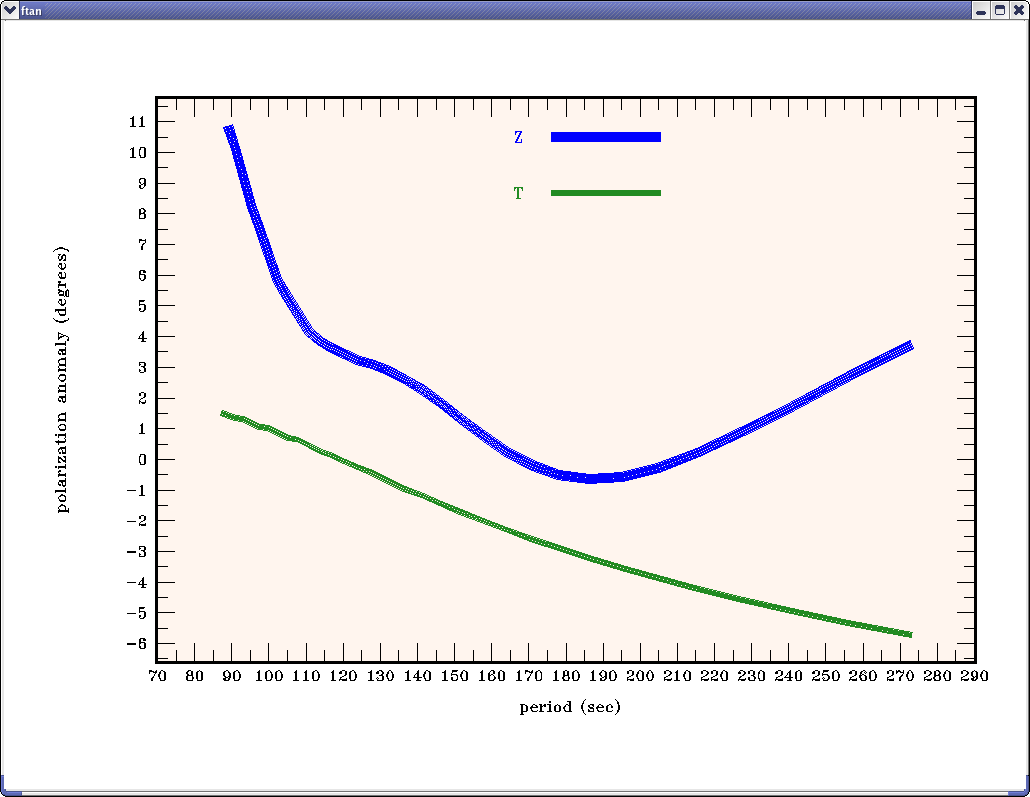
To view the FTAN estimates of polarization anomalies
push button  .
.
Here is an example of picture of polarization anomalies:
To view the picture of cleaned and raw seismograms push
the button  .
.
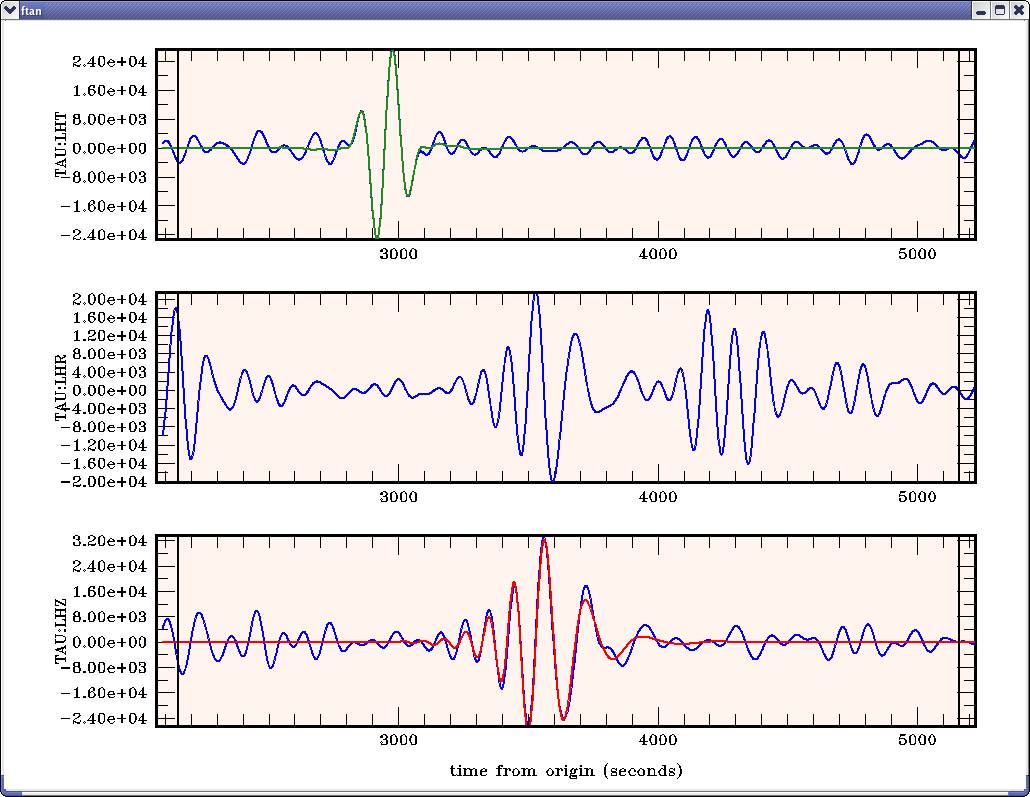
Here is an example of picture of filtered and raw signals:
To view a picture of FTAN diagrams for cleaned and raw records push the button
 .
.
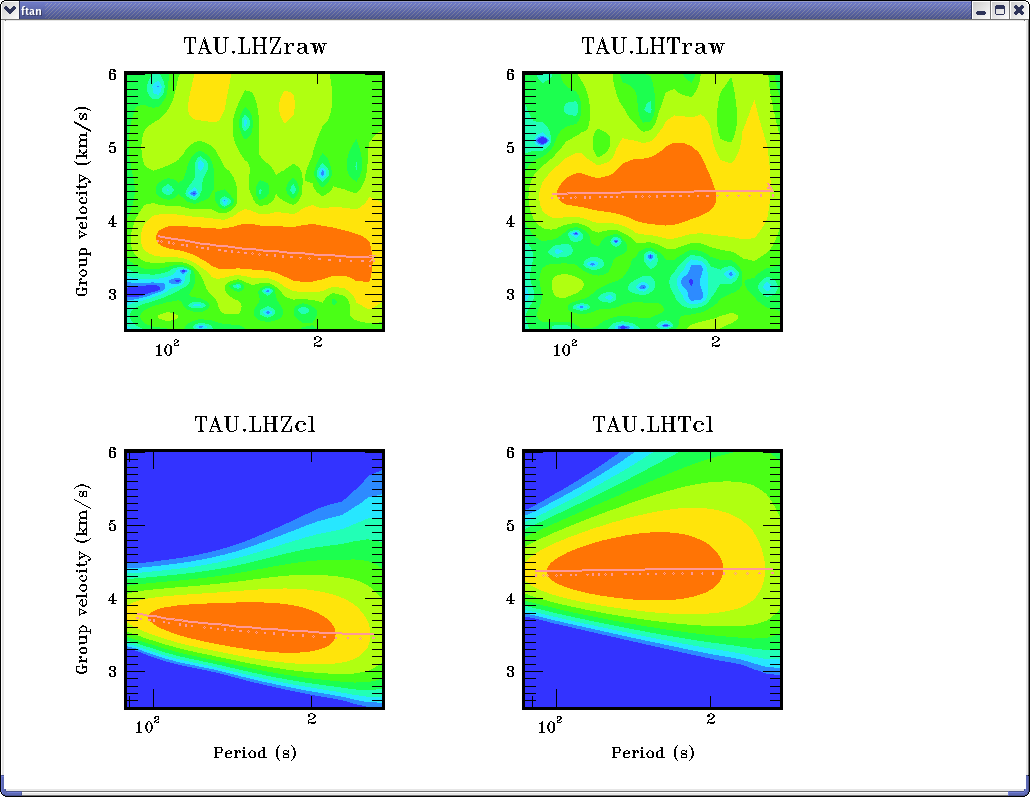
Here is an example of picture
of FTAN maps for filtered and raw seismograms:
To clean any of processed components push the button
 . The Clean Records Dialog window will appear.
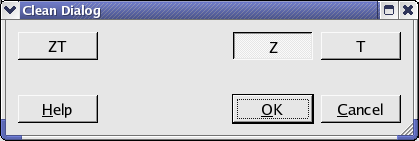
Click component toggle buttons required to be cleaned. Click OK button to perform the cleaning, or Cancel - to close the window without cleaning.
To save results click the button  . The Save Records Dialog will appear.
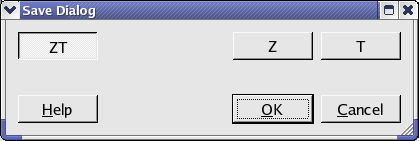
Click component toggle buttons required to be saved. Click OK button to save records, or Cancel - to close the window without saving.
Select next station-channel. Button
changes green color to yellow
and you can work with new selection.
| Copyright © 1998 - 2005 Mitpan | Fmt-1.40 |