| Home| Content |
|
Before we start the inversion procedure, the following steps have to be followed
![]() 1.Selection of records to be used for inversion
1.Selection of records to be used for inversion
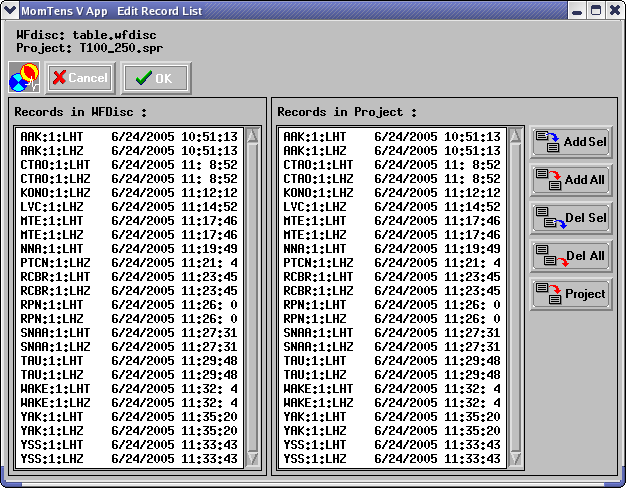
The window based dialog as shown here below selects the records to be used for inversion. The names of available records are listed in the left frame, the names of records selected for inversion - in the right frame. By default the content of these two frames is the same
![]() 2. Structural models and related
stations
2. Structural models and related
stations
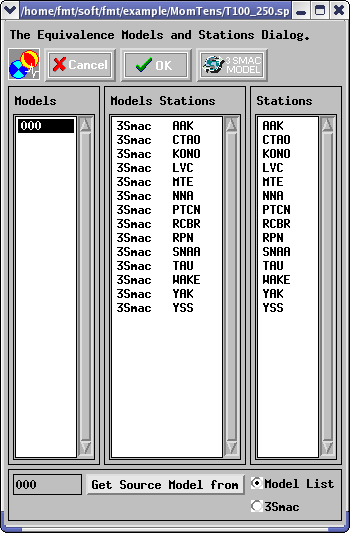
The window below provides possibility to calculate the structural
model for part of stations by 3SMAC program, and to put in correspondence
to the rest of stations given models from directory MODELS. The same can be
done for the epicentral zone. If there are models to be calculated by 3SMAC
program, push at first the button "3 SMAK MODEL". 3SMAC models will be calculated
for all stations and for the epicentral zone. If the model for any station
must be taken from directory MODELS click on the model name in the left column
(files from directory MODELS) and on correspondent station in the right column.
If the model for the epicentral zone must be taken from directory MODELS
click on correspondent model name in the left column, push the radio button
"Model List", and button "Get Source Model from". In the example below the
model from file "000.mod" will be used for the epicentral zone, and for all
stations models calculated by 3SMAC program will be used
![]() 3. Spectral
Range Discretization
3. Spectral
Range Discretization
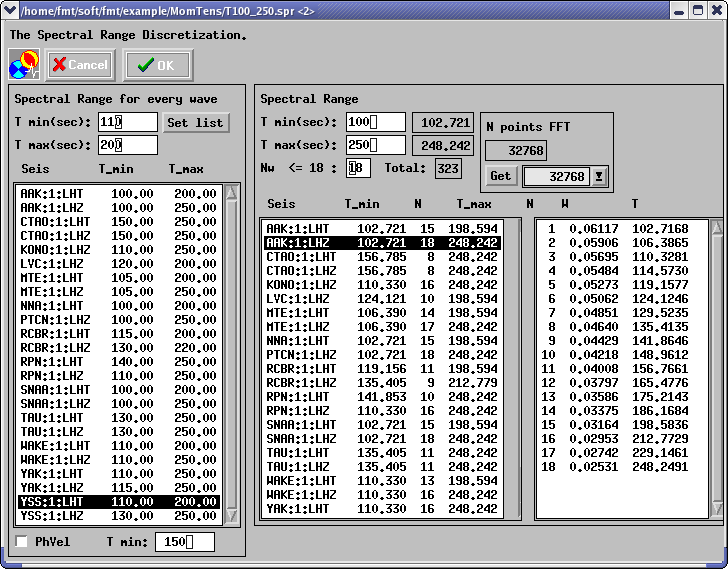
3a. Appropriate Spectral Range for every recorded wave
During preliminary filtering by FTAN program, a spectral
domain, definedby maximum and minimum periods, is to be determined for every
wave wherethe signal is of a good quality. These period values go in
the text boxes "T min" and "T max" in the uppermost leftpart of the
window. To associate thispair of values to any record, the user has
to click on the right record name.
3b. Spectral grid
After the spectral boundaries for every record are fixed,
the spectral range for inversion has to be chosen. Minimum and maximum periods
has to be typed in "T min" and "Tmax" text boxes in the central part
of the window. A maximum number of spectral samples (<= 18) has to be typed
in the text box Nw. The number of samples for the Fast Fourier Transform program
calculating the spectra is the last parameter to be defined. Push the arrow
in the combo box, choose the number, and push "Get" button. Actual spectral
boundaries for every record will appear in the central window. If you will
mark by cursor any record in this window, spectral samples relatedto this
record will appear in the right window.
3c. Minimum period for phase spectra inversion
By default the observed phase spectra will be used for the
inversion in the full spectral domain. Model PREM will be used in this case
to calculate the surface wave phase velocities. If you will type in the text
box T min (in the lowermost left part of the window) any value of the
period , then the phase spectra will be used for the inversion only
for the periods lager than this value. If you will click on the check box
"PhVel" and the directory PH_VEL containing the files with surface wave
average phase velocities is already existing,then these velocities interpolated
on the grid defined above will beused for computations.
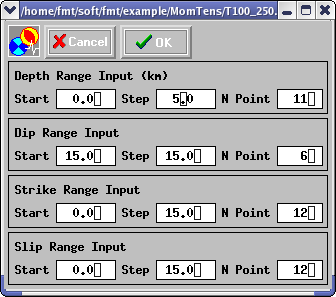
![]() specification
specification
This window allows you to specify the grid for the source
parametric model. This model is specified by the double couple depth (in km)
and three angles (in degrees): dip, strike and slip. For each of
these parameters you have to specify the starting value, the step, and
the number of samples (N Step) using the appropriate text box.
Note:
It will be impossible to close up this window and a warning
message appears, in the case where the parameters do not satisfy the
following constrains:
N Step of depth <= 100;
N Step of dip <= 6;
N Step of strike <= 12;
N Step of slip <= 12;
< start of dip > + < step ofdip
> * ( < N Step of dip > - 1 ) <=
90;
For a complete exploration of the focal sphere, it is enough
to assign in the following window halfof the full interval for strike
and slip angles. The symmetric mechanisms are also investigated during the
inversion. An example of parameters specification is shown below.
![]() rarefication of polarity data
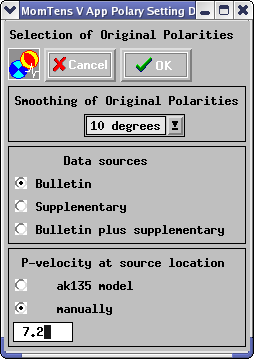
rarefication of polarity data
Upper frame is related to selection of the value of the angleof
polarity data smoothing. Push the arrow in the combo box and select
the value. Middle frame shows the list of polarity data sources contained
in directory POLAR ("bulletin" or/and "polarity.sup").
If both data source types are available three radio buttons will appear.
Push radio button correspondent to polarity data sources to be used. In example
shown below there are both files in directory POLAR, but only bulletin is
selected for inversion.
Lower frame provide possibility to set a value of P wave velocity
in the source location to be used for take off angle calculation. Push radio
button "manually" and type the value in the text box below. The other possibility
is to take this value from AK135 model at the source depth (taken from Data
Base). To do this push radiobutton "ak135 model".
After all selections are done push OK. Stereographic projectionsof
focal sphere with original and selected polarities will appear in a PostScript
Viewer window. To go back to the main window, select Fileand then Quit.