| Home| Content |
Exercise 10. Drawing histograms
CompiCat allows the user to display graphically different kinds of histograms. For details see 7.8 Draw histograms
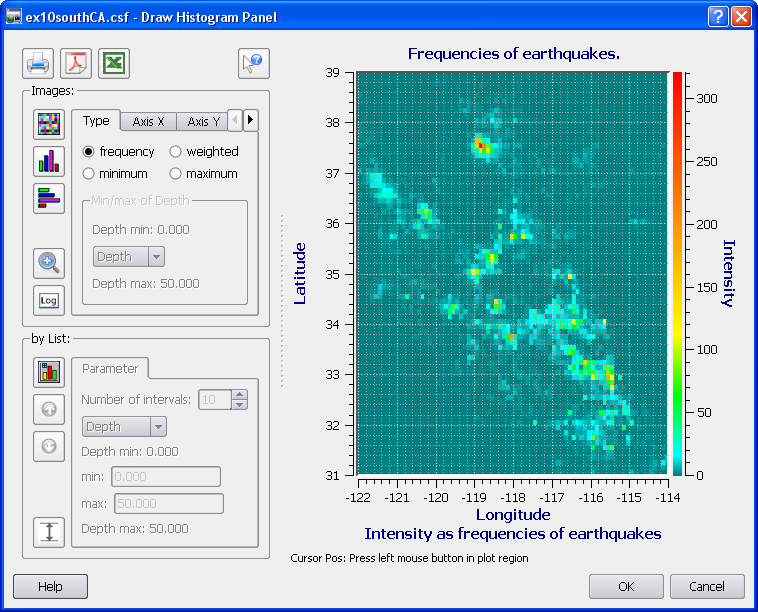
Task 1: Plot frequencies of the earthquake occurrence inside 0.1 by 0.1 degree cells on the map within latitudes from 31 N to 39 N and longitudes from 122 W to 114 W.
1) Run CompiCat: Open the file ...\ecp\exercises\ex10southCA.csf.
2) Click Draw histograms button ![]() in the vertical Tools bar on the left. Open XY-axes tabs in the Images
frame and type in the appropriate limits on latitudes and longitudes. Change
the Number of intervals to 80 on both axes X and Y tabs, so that
to satisfy the 0.1 by 0.1 degree cell size requirement. Click Draw 2-D
histogram button
in the vertical Tools bar on the left. Open XY-axes tabs in the Images
frame and type in the appropriate limits on latitudes and longitudes. Change
the Number of intervals to 80 on both axes X and Y tabs, so that
to satisfy the 0.1 by 0.1 degree cell size requirement. Click Draw 2-D
histogram button ![]() .
.
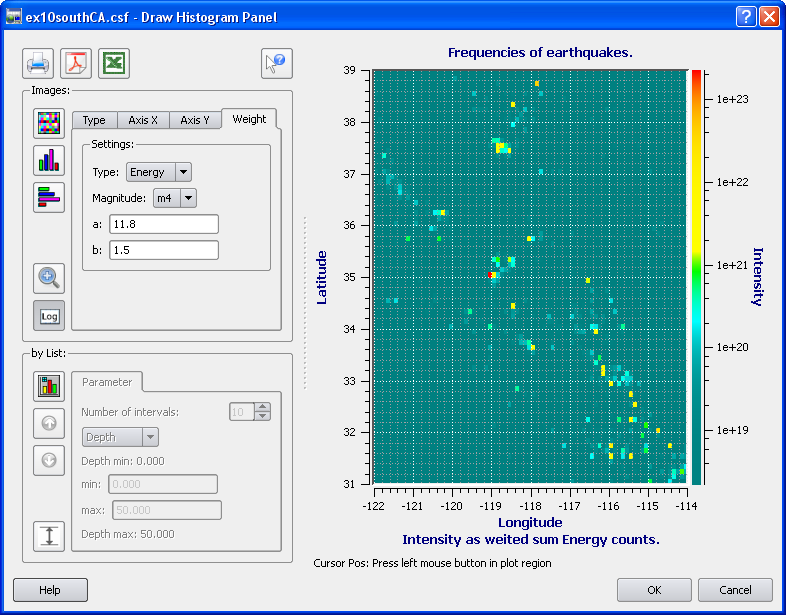
3) To get an insight on distributions of the energy release,
or the area ruptured, or the total length of ruptures Redraw histograms
using the Energy, or Area, or Length options in the Weight tab.
For this purpose check on the radio button on in the Images
frame of Weight tab, select m4 as the Magnitude, select Energy as the
Type, and re-Draw
2-D histogram button ![]() . Toggle the Linear/Log10 scale button to view both options
of the histogram display.
. Toggle the Linear/Log10 scale button to view both options
of the histogram display.
4) If you wish, save any image of resulted histograms as PDF or PS in the ...\work directory.
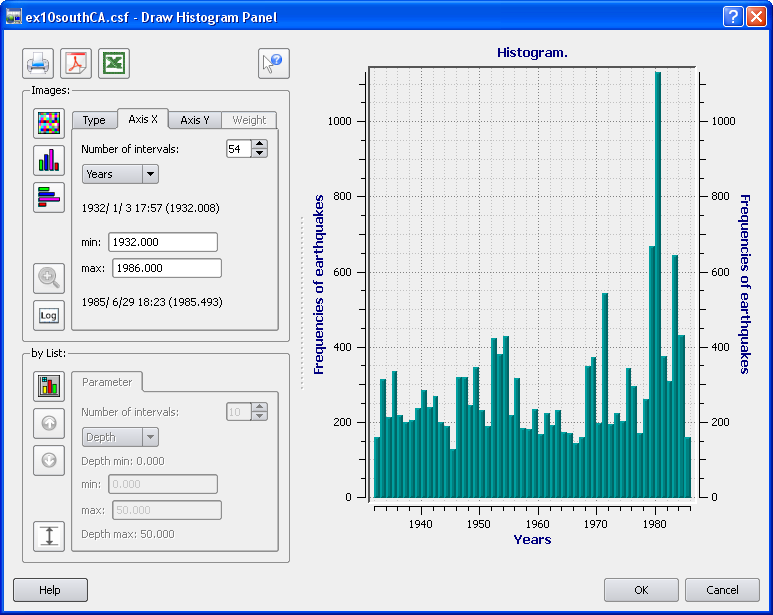
Task 2: Plot the annual frequencies of the earthquake occurrence in 1932-1986.
1) Make sure that the radio button off in the Images frame of Weight tab is checked on.
2) Change X-axis tab for Years and type
in the requested min and max limits (i.e., 1932.0 and 1986.0,
correspondingly). Make sure that the Number of intervals equals 54, so
that to fit the request for the annual frequencies, and click Draw 1-D
histogram button ![]() .
.
Task 3: Plot by List the annual frequencies of occurrence of the earthquake from magnitude ranges between 3 and 4, 4 and 5, 5 and 6, 6 and 7, and 7 and 8 in 1932-1986.
1) Toggle Invoke by List button ![]() . Select m4 as the by list parameter. Set the minimal magnitude to
3, the maximal one to 8, and the Number of intervals to 5.
. Select m4 as the by list parameter. Set the minimal magnitude to
3, the maximal one to 8, and the Number of intervals to 5.
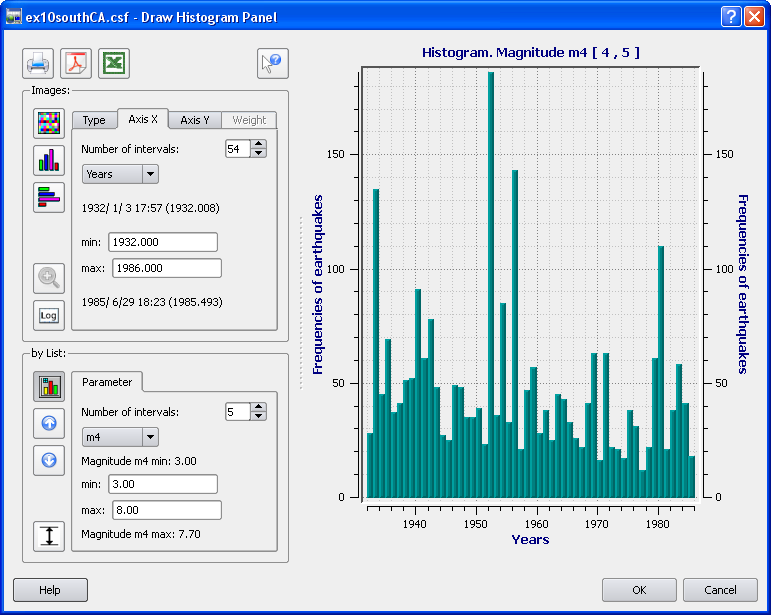
2) Click Draw 1-D histogram button ![]() . Click
. Click ![]() or
or ![]() button to display the previous or the next histogram in a series.
button to display the previous or the next histogram in a series.
The three tasks represent the simplest examples of histograms that may help analyzing the spatial, temporal, and energy structure of earthquake sequences from a given catalog. There are many other kinds of histograms that facilitate understanding of seismic dynamics of the tectonic region under study.
| Copyright © 2008 MITPAN |
ECP 1.3.0
|